 .pdf
.pdf
Tools in Project Management
What is a Milestone?
A milestone in project management is a significant event or point in the project timeline that marks the completion of a major phase or task. Milestones are often used to:
-
Measure progress: By marking important points, you can assess if the project is on schedule.
-
Highlight deadlines: Milestones represent key deadlines that need to be met to move the project forward.
-
Reflect achievements: Reaching a milestone signifies the completion of a critical part of the project.
For example, in a software project, some common milestones might include:
-
Requirements completion: All necessary features and requirements for the software have been defined.
-
Design approval: The software’s architecture and design are approved for development.
-
First working prototype: A functional version of the software, even if limited in scope, is built and can be demonstrated.
Gantt Charts
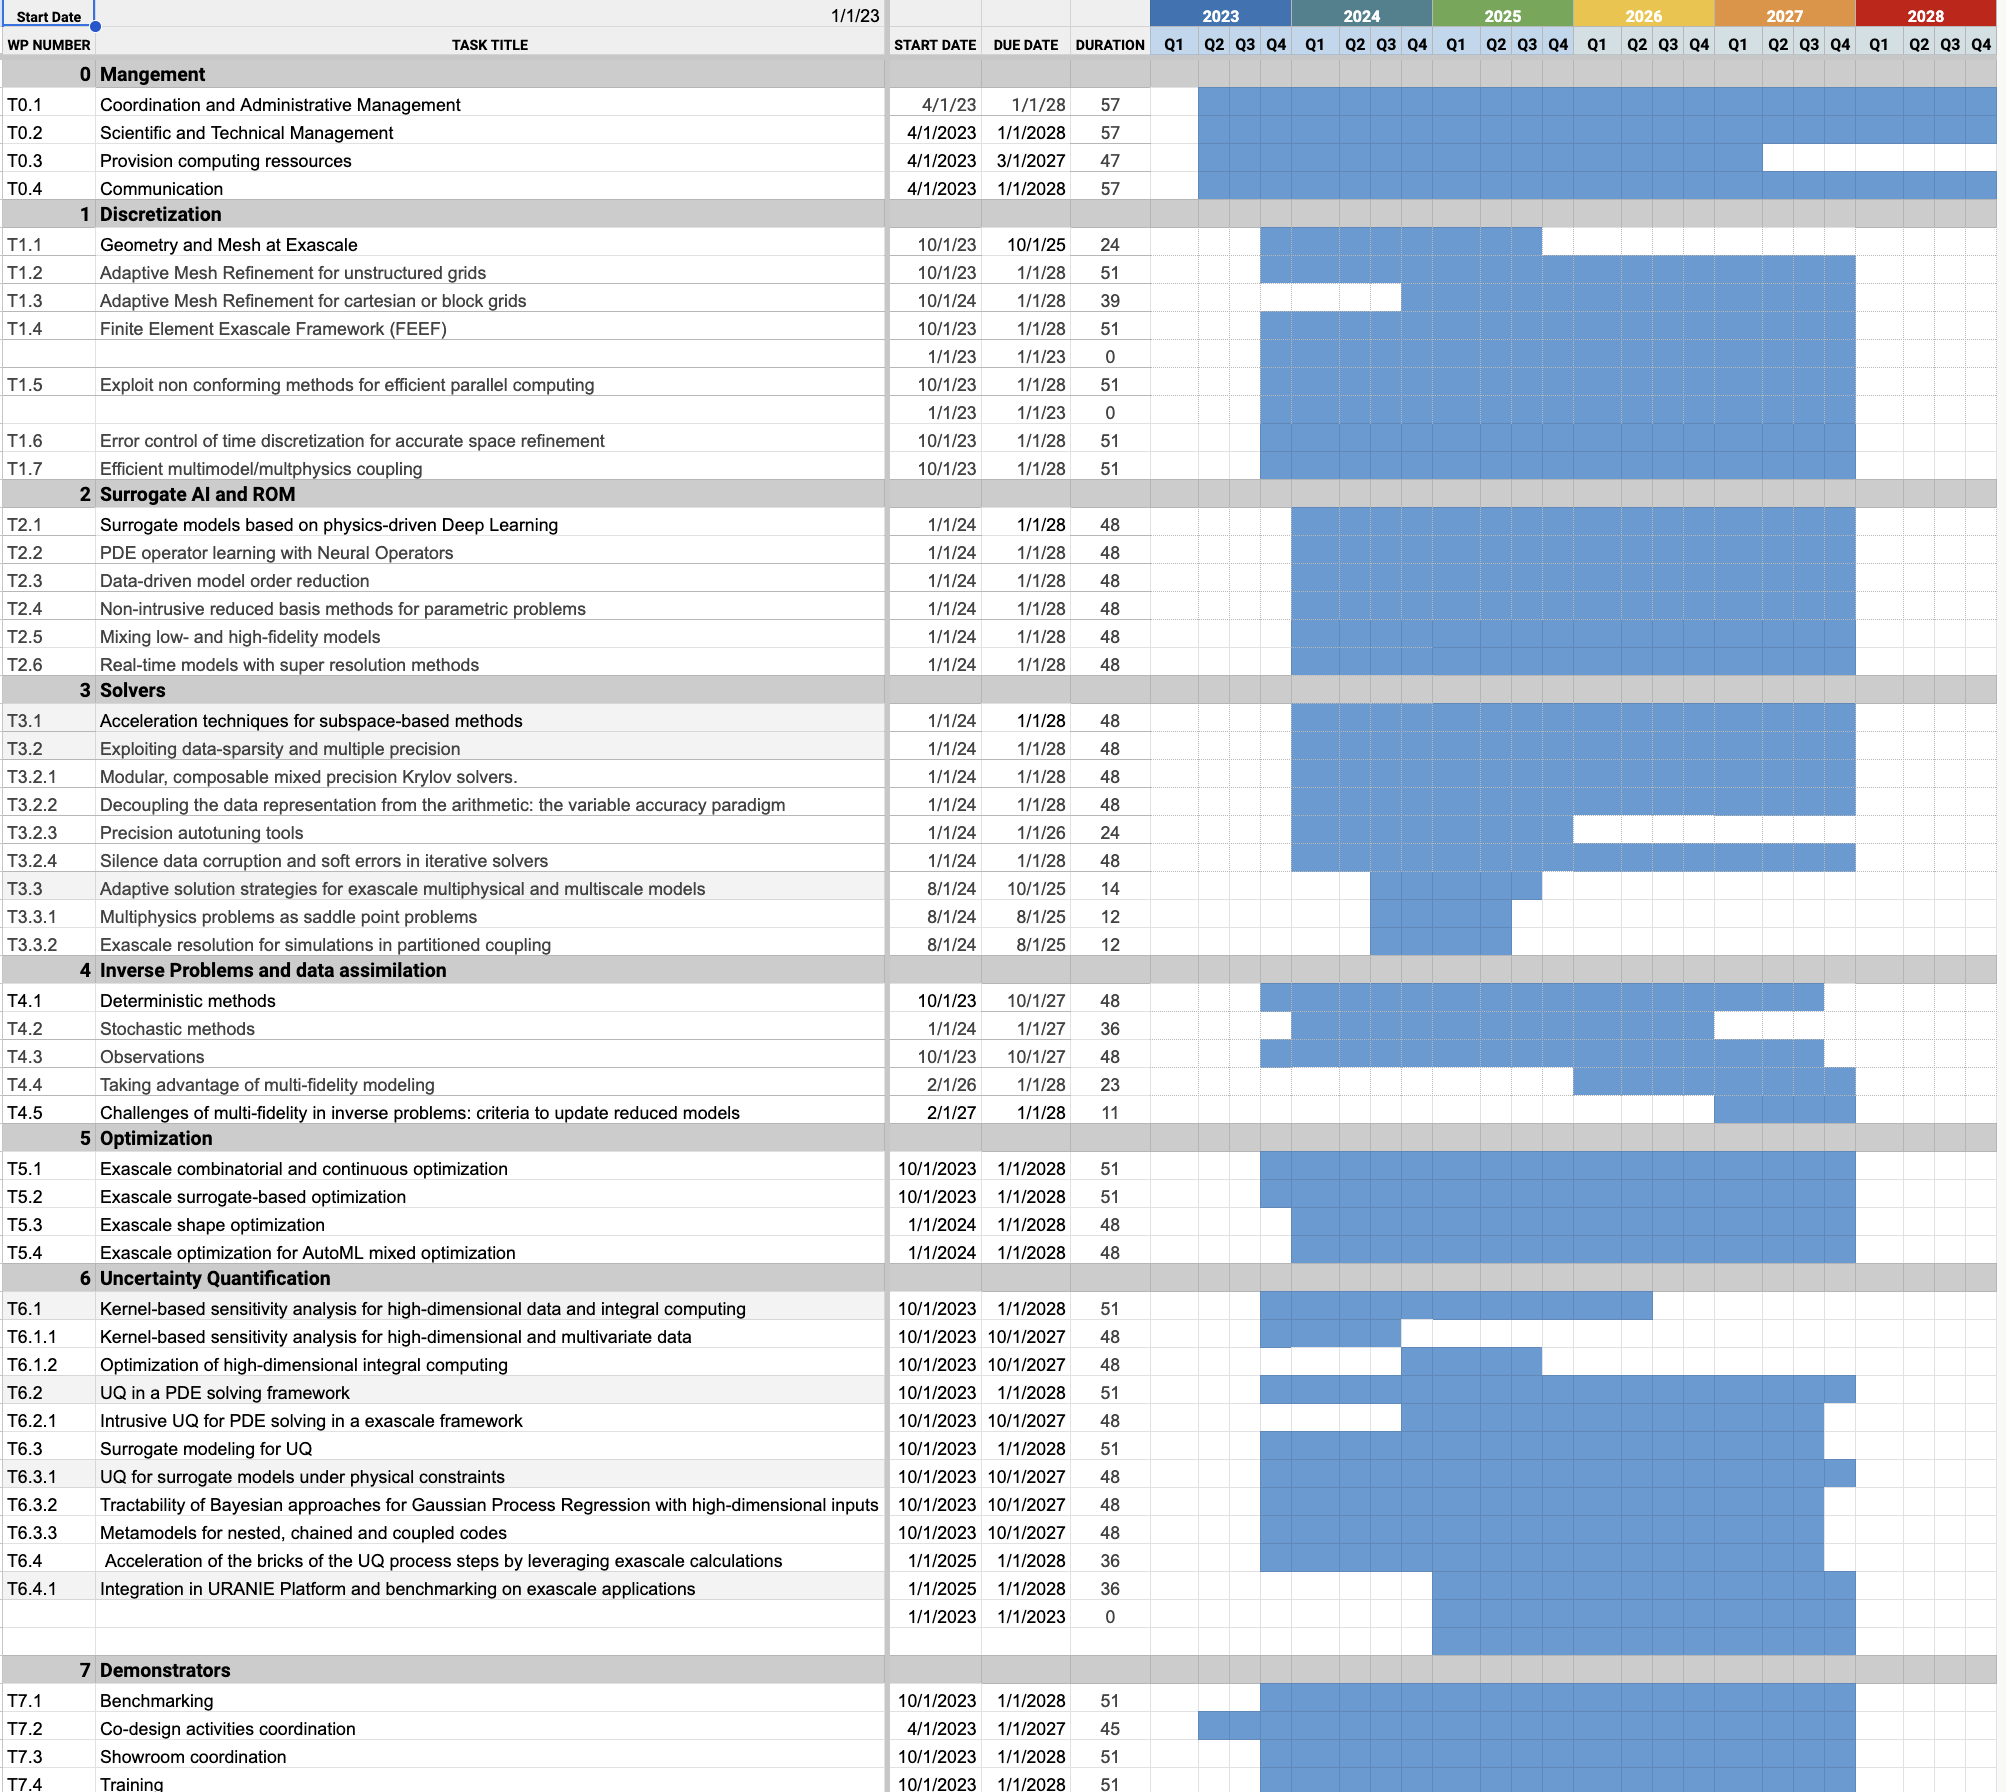
A Gantt Chart is an essential tool for project management that provides a visual representation of a project’s timeline. It is typically structured as follows:
-
Rows represent tasks or milestones within the project.
-
Columns represent time intervals, such as days, weeks, or months.
-
Bars span across the time intervals, showing the duration of tasks.
-
Arrows may indicate dependencies between tasks.
Gantt charts are a powerful tool for visualizing dependencies and progress across the project timeline.
Key Elements of a Gantt Chart
-
Tasks/Milestones as Rows Each row in the Gantt chart represents a task or a milestone.
-
Time Intervals as Columns The columns represent the timeline broken down into time intervals (days, weeks, or months).
-
Task Spanning Tasks are visualized as bars across the time intervals, indicating when they begin and end.
-
Task Dependencies Dependencies between tasks can be displayed using arrows, indicating that one task must be completed before another can start.
-
Progress Tracking Tasks are often shown with a percentage of completion to easily monitor the project’s progress.
-
Critical Path The sequence of tasks that must be completed on time for the project to meet its deadline is highlighted as the critical path.
Benefits of Gantt Charts
-
Visual Overview: A Gantt chart provides a clear, visual timeline of a project’s tasks.
-
Task Dependencies: It shows relationships between tasks, ensuring team members are aware of task dependencies.
-
Progress Monitoring: It enables tracking the completion status of each task to ensure the project remains on schedule.
-
Resource Management: Resources can be efficiently allocated based on the project timeline.
Example of a Gantt Chart
Consider the development of a Digital Twin for a Manufacturing System project:
| Task Name | Start Date | End Date |
|---|---|---|
Kick-off Meeting with Stakeholders |
Month 1, Week 1 |
Month 1, Week 1 |
Identify Data Sources |
Month 1, Week 2 |
Month 1, Week 3 |
Define Key Metrics |
Month 1, Week 4 |
Month 2, Week 1 |
Develop Digital Twin Simulation Model |
Month 3, Week 1 |
Month 5, Week 3 |
Test with Real-Time Data |
Month 6, Week 1 |
Month 6, Week 4 |
By following this Gantt chart, teams can visualize the full scope of the project, track its progress, and ensure it remains on schedule.